Data Dashboard
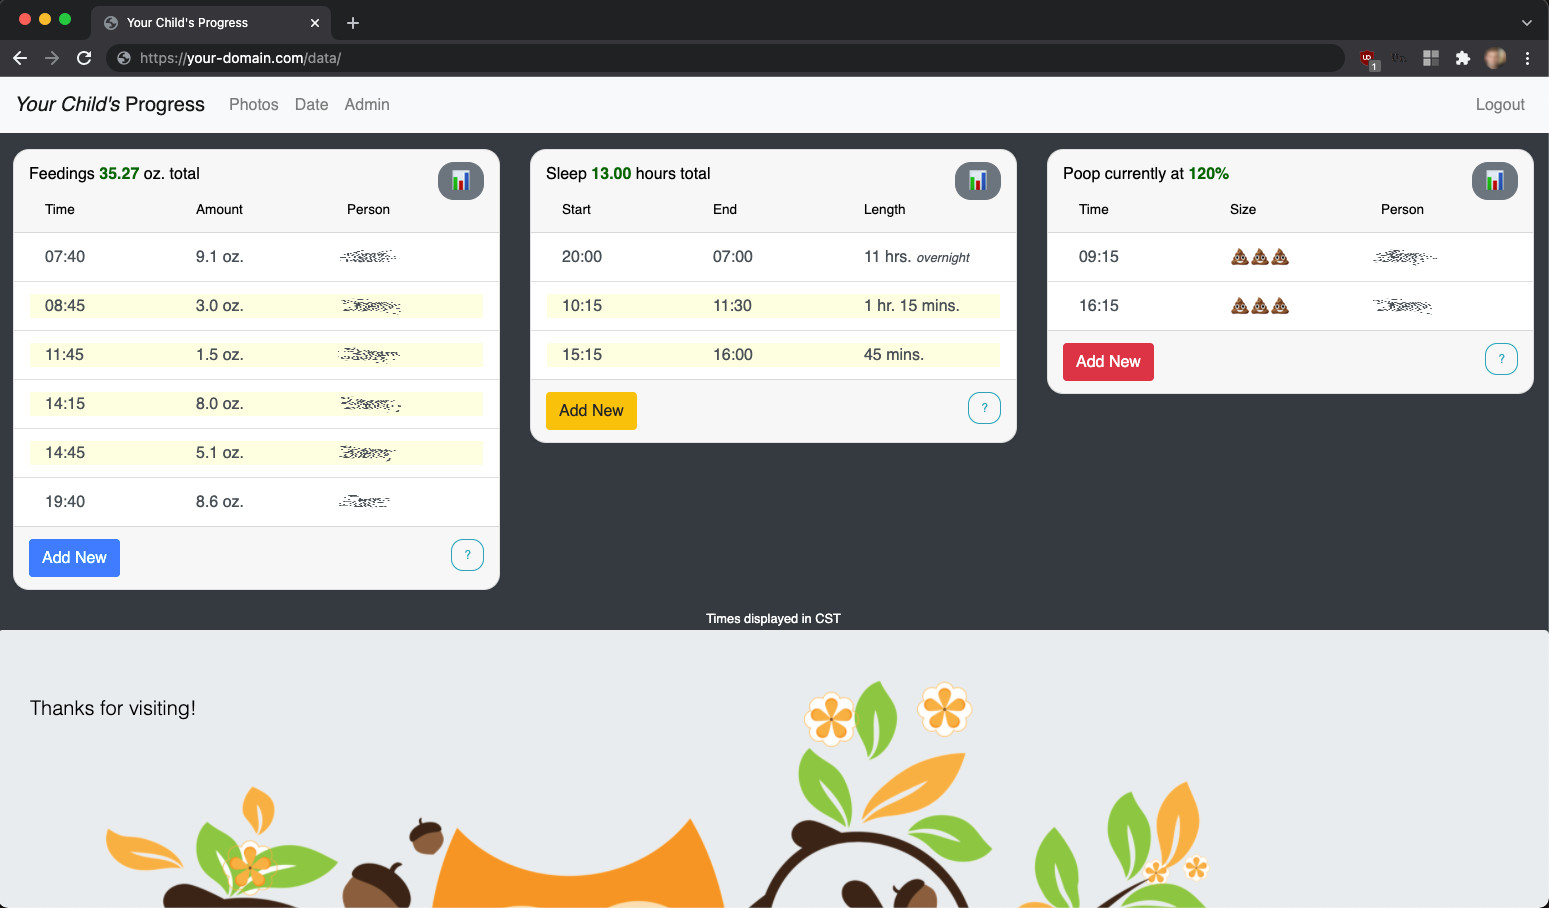
Signed-in users can record Feedings, Sleep periods, and Poops so you can easily remember how the day is going and plan for what's next.
Woke up a little early today? Might need a longer nap. Hasn't pooped in 72 hours? Keep an eye on that diaper and avoid a blowout! Aid communication with the data dashboard.
“I like how I can view the dashboard both on my desktop and my iPhone, where updates from either device or another user instantly update on all devices.”
We're all heard the modern adage “If if's free, then you're the product!”. When you are running the site and control all ingress and egress you don't have to worry about who is using your data for what.
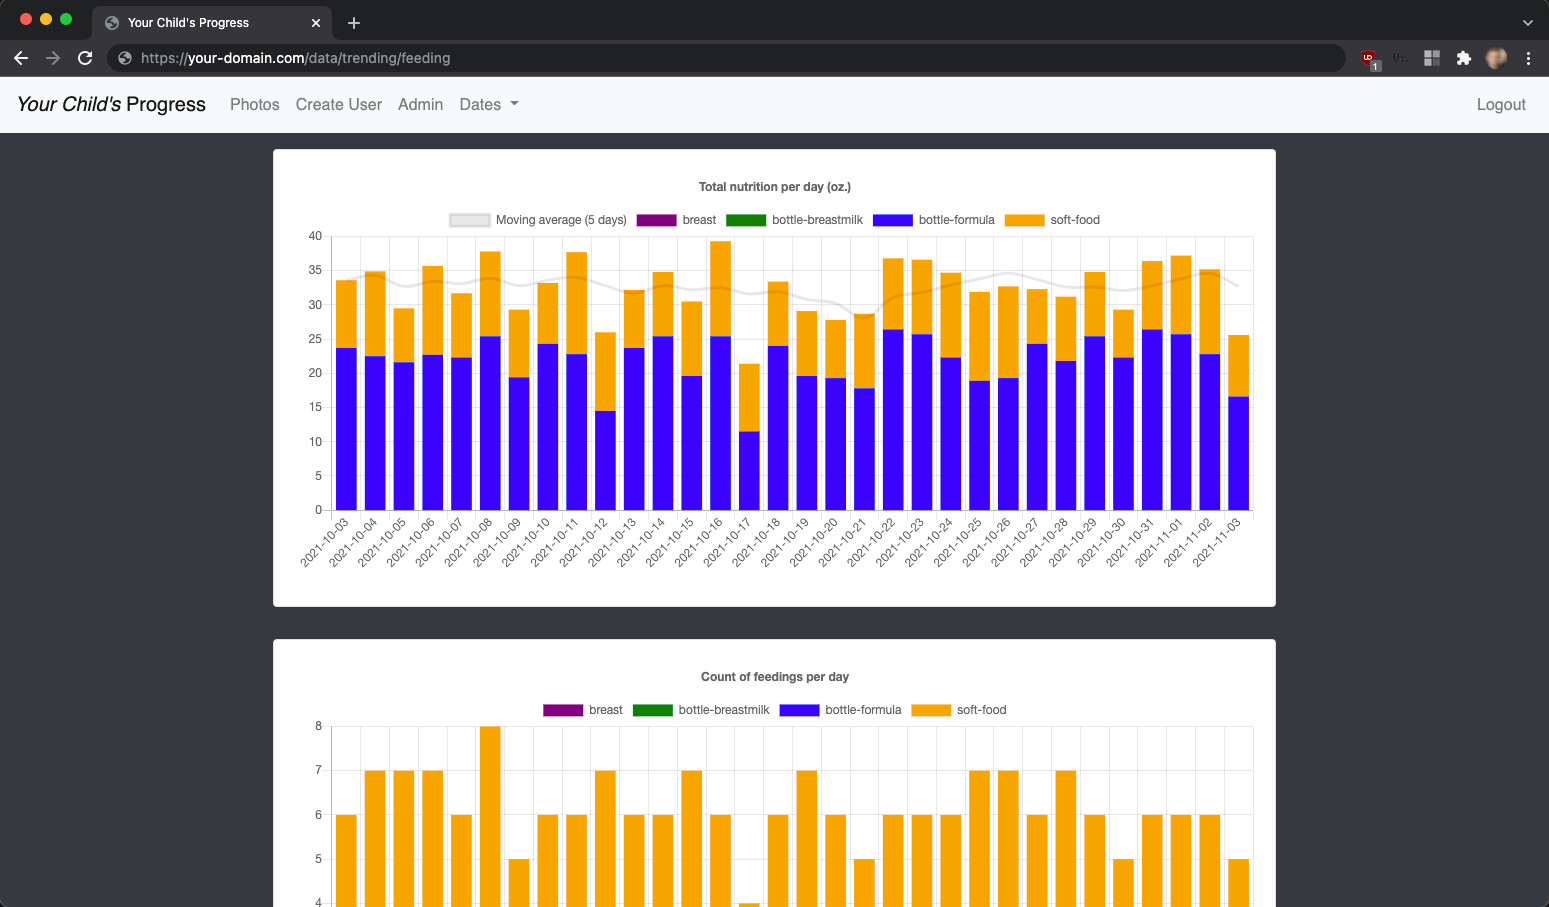
Easily view graphs that show day-over-day totals and binned time-of-day histograms.
“When our daughter was younger and "set her own schedule", it was easy to see patterns in the data.”
Additional Screenshots
Here's a few additional screenshots of the Data Dashboard feature.
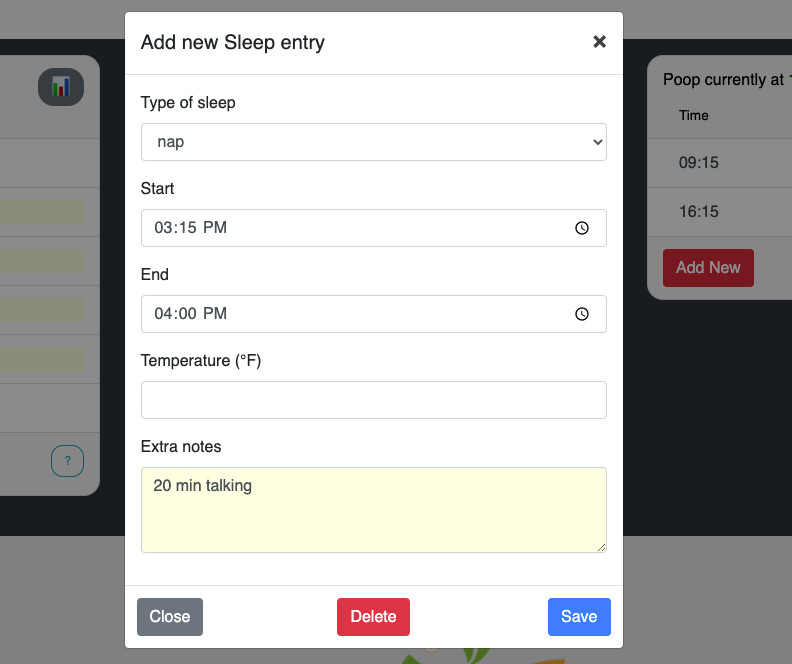
Here's what the modal that houses the Sleep Input Form looks like.
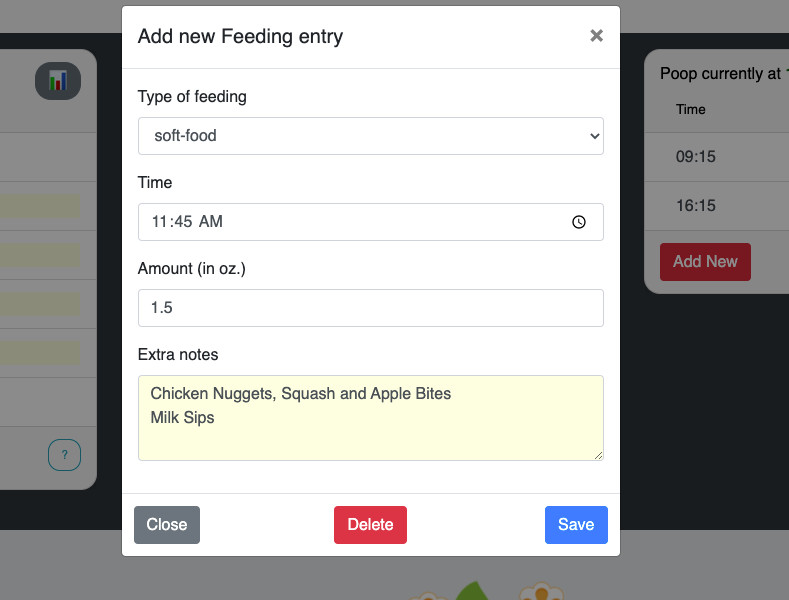
Here's what the modal that houses the Feeding Input Form looks like.
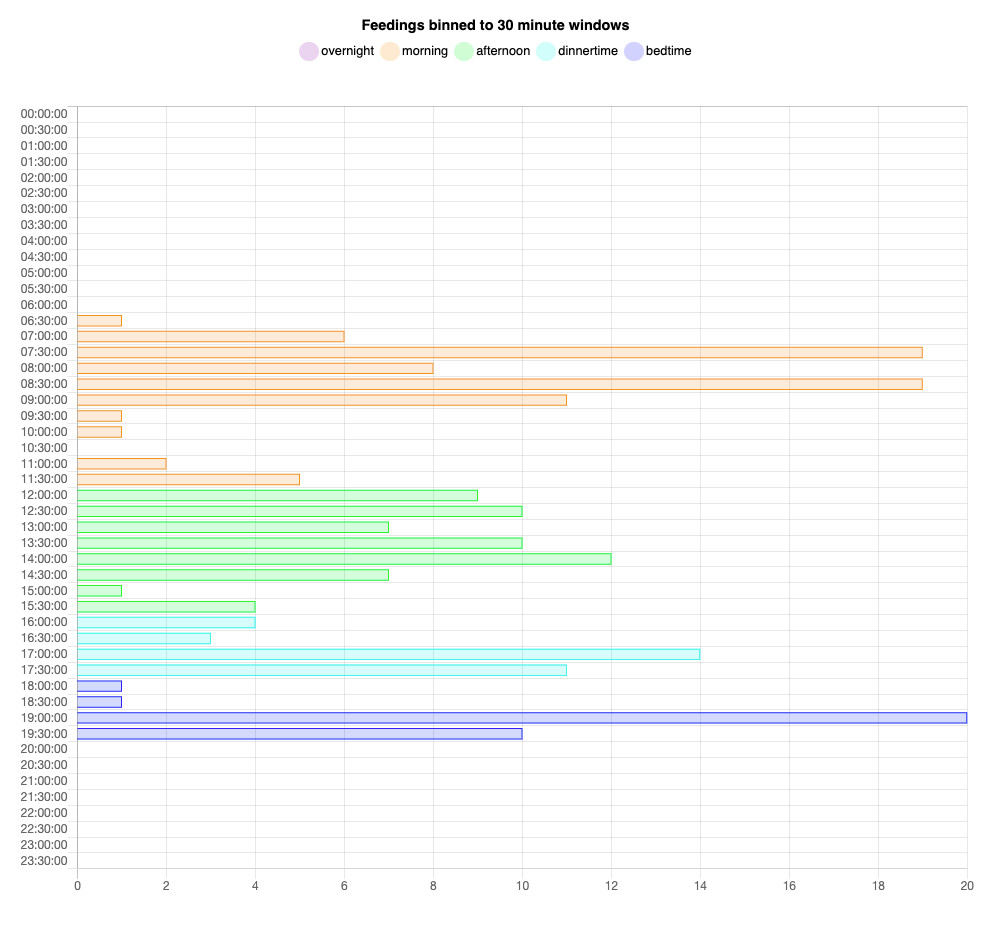
In addition to trending, Owlkins will show binned feedings which give a picture of how close feedings are distributed to certain times in a day.
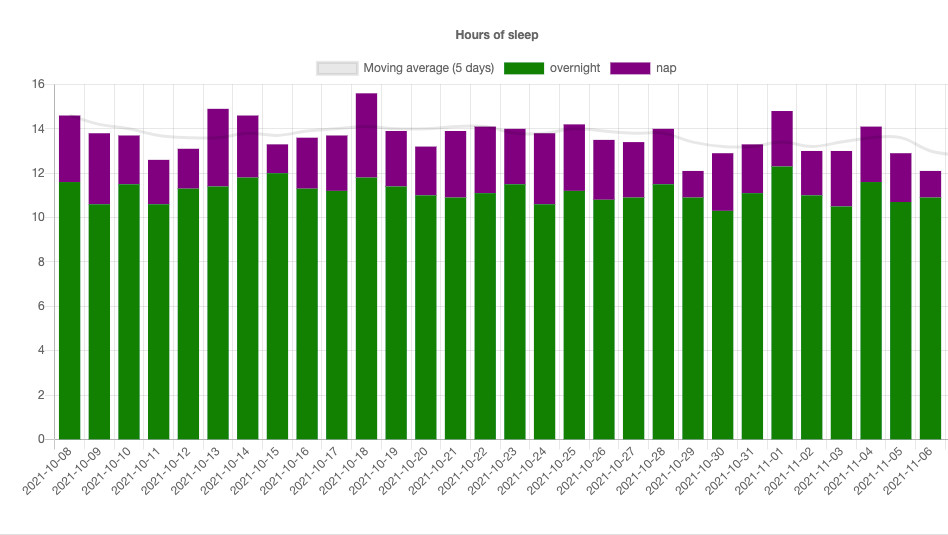
Easy see total sleep separated by "overnight" and "nap" classifications with a trendline for the total for the day.
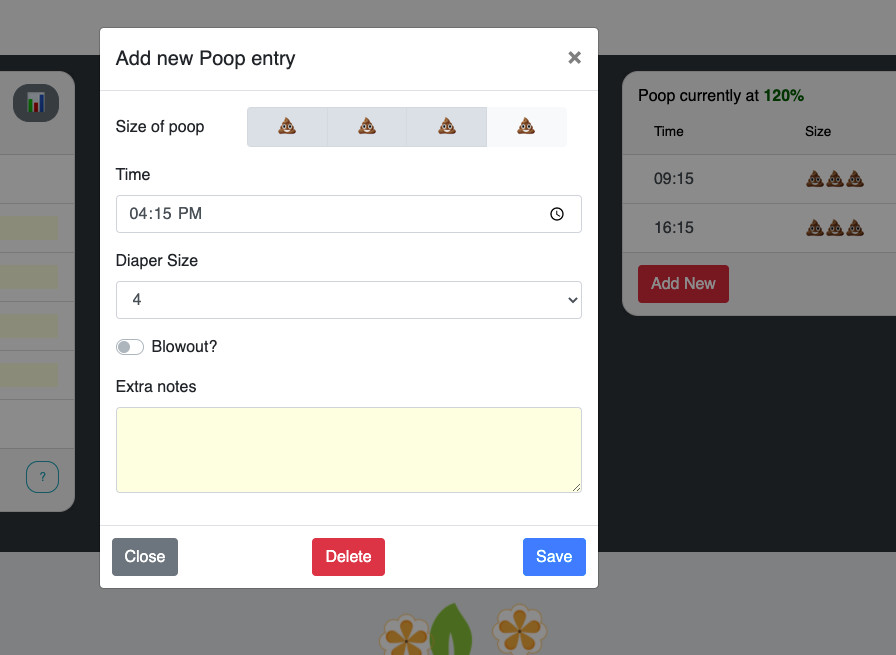
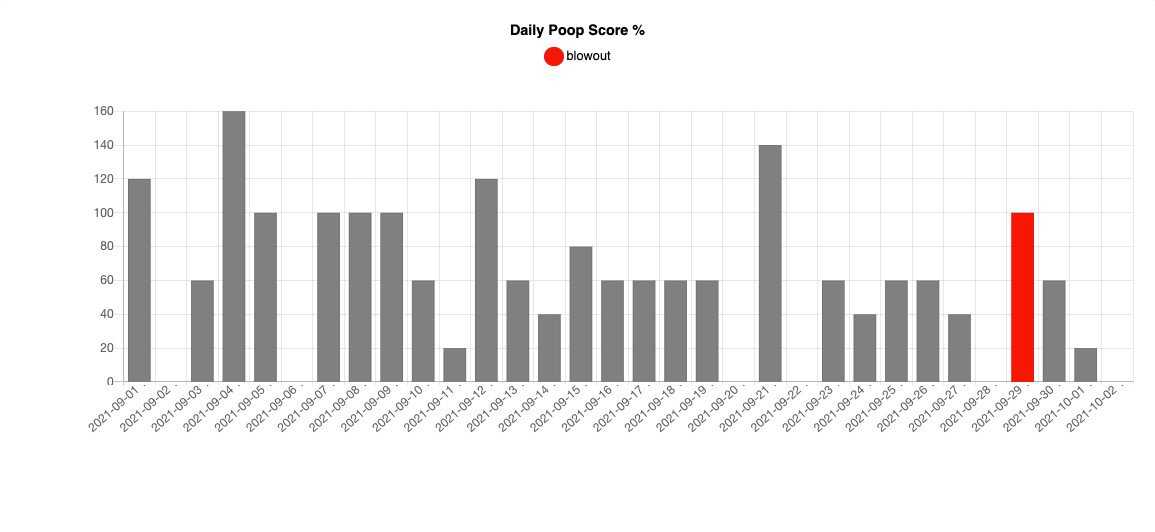
Every parent wants to avoid a blowout. Track poop trending and see where you have blowouts to scheme up ways to avoid another.
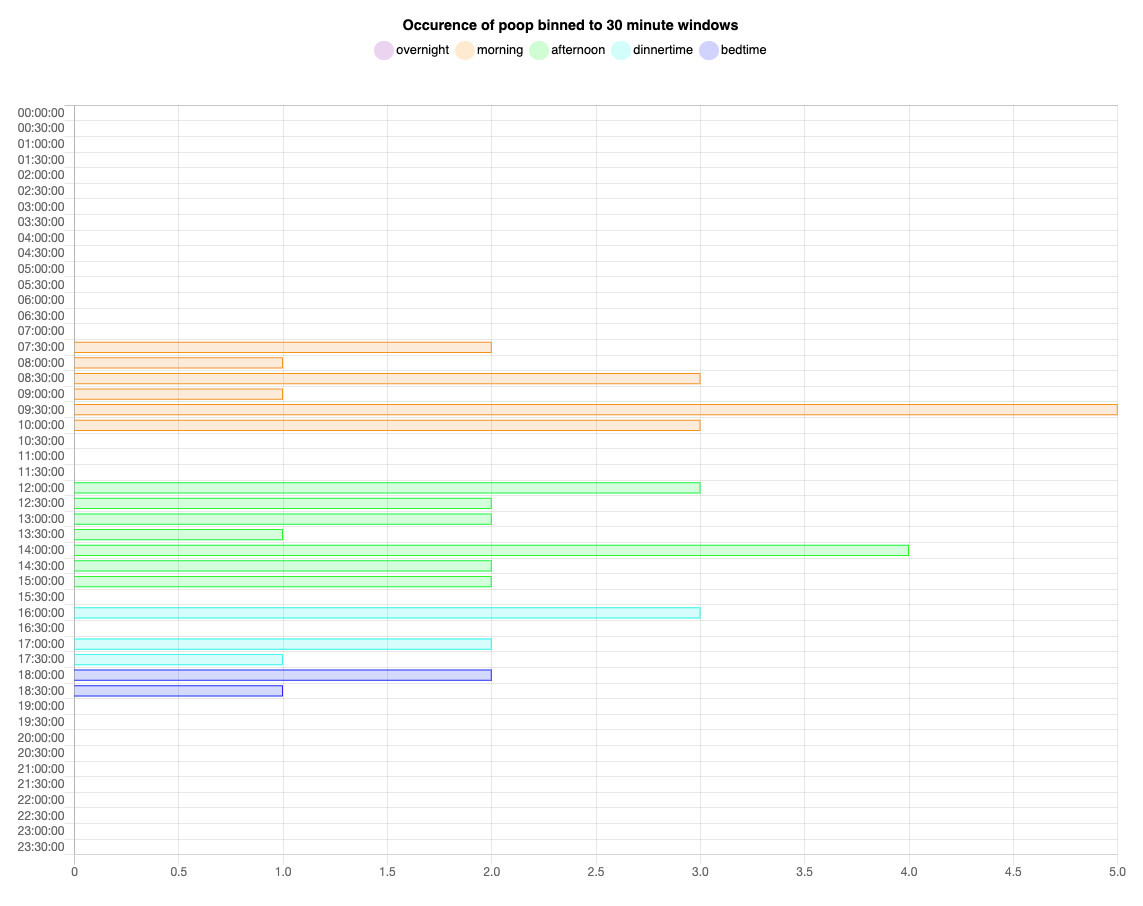
Speaking of avoiding blowouts, checking when poops historically happen within a day can help you start to "predict" when the next one might be coming.
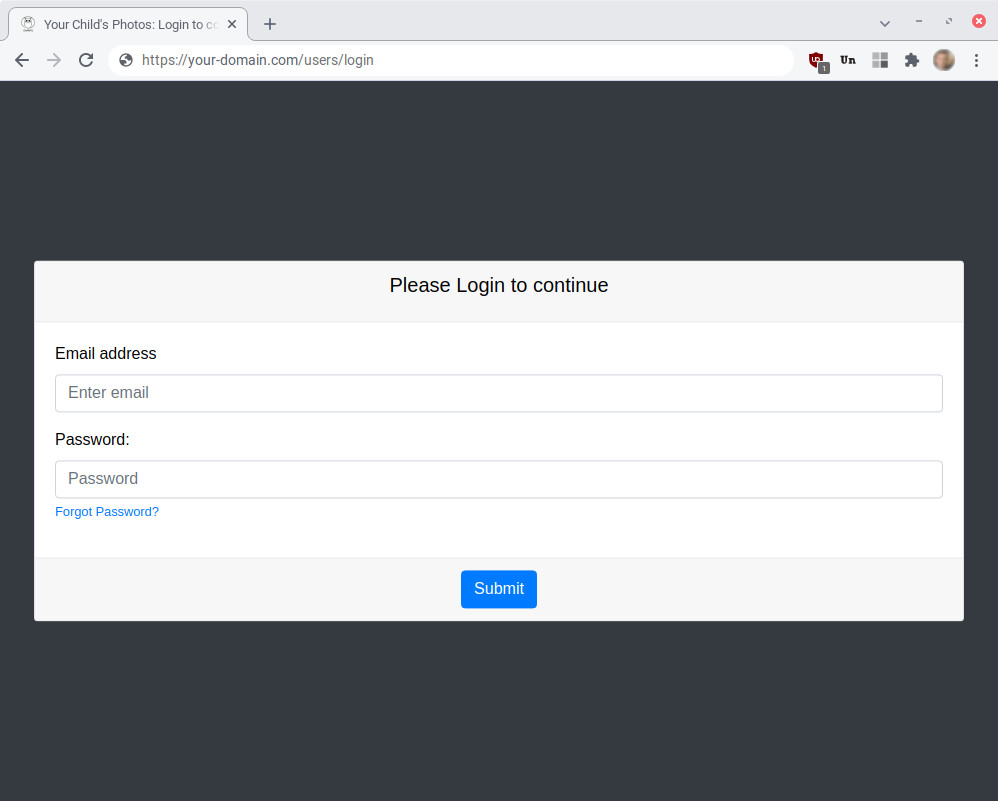
Before a user can view the Data Dashboard, they will have to log in.